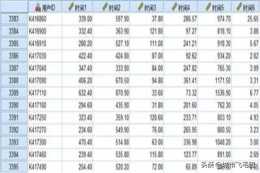
一、為針對使用者精細化運營。從半年月均增長率和半年產品消費額兩個維度上,對使用者做聚類分析,建模。把使用者分為五大類。


二、程式碼實現
data=read。csv(“D:\****\20160912boblecluster。csv”,header=F)
newdata<-data[,c(‘V2’,‘V3’)]
library(sqldf)
#資料處理
newdata<-sqldf(“select case when V2>40000 then 40000 else V2 end as product_consumption_amount,case when V3>2 then 2 else V3 end as increase from data limit 30000”)
確定探索聚類合理個數(根據拐點判斷)
wss <- (nrow(scale(newdf[2:3]))-1)*sum(apply(scale(newdf[2:3]),2,var))
for (i in 2:10)
wss[i] <- sum(kmeans(scale(newdf[2:3]),i,algorithm=“Lloyd”)$withinss)
###這裡的wss(within-cluster sum of squares)是組內平方和
plot(1:10, wss, type=“b”, xlab=“Number of Clusters”,ylab=“Within groups sum of squares”)
#聚類
根據分析研究決定分為5個類
#centers是聚類的個數或者是初始類的中心, algorithm為動態聚類的演算法 “Hartigan-Wong“(預設時), ”Lloyd“,”Forgy“, ”MacQueen
#iter。max 為最大迭代數預設值為10,nstart是隨機集合的個數(當centers為聚類的個數時)
kc <- kmeans(scale(newdf[2:3]),5,nstart=20,algorithm=“Lloyd”)
#plot(newdata[c(“product_consumption_amount”, “increase”)],col=kc$cluster,pch = 20,ylab=“半年內消費增長率”,xlab=“產品消費金額(元)”,main=“貴族使用者分類”)
#聚類分佈
x=table(kc$cluster)
result_df <- data。frame(newdf,kc$cluster)
#匯出資料
write。table (result_df, file =“F:\\R&Nutch\\R語言\\聚類分析\\resulr。txt”, sep =“\t”, row。names =TRUE, col。names =TRUE, quote =TRUE)
#在圖上標出每個聚類的中心點
#points(kc$centers[,c(“product_consumption_amount”, “increase”)], col = 1:6, pch = 8, cex=2)
“cluster”是一個整數向量,用於表示記錄所屬的聚類
“centers”是一個矩陣,表示每聚類中各個變數的中心點
“totss”表示所生成聚類的總體距離平方和
“withinss”表示各個聚類組內的距離平方和
“tot。withinss”表示聚類組內的距離平方和總量
“betweenss”表示聚類組間的聚類平方和總量
“size”表示每個聚類組中成員的數量)
Within cluster sum of squares by cluster: 每個聚類內部的距離平方和
ggplot2畫圖
cor=(kc$cluster)
cor=ifelse(cor==1,‘A’,cor)
cor=ifelse(cor==2,‘B’,cor)
cor=ifelse(cor==3,‘C’,cor)
cor=ifelse(cor==4,‘D’,cor)
cor=ifelse(cor==5,‘E’,cor)
#install。packages(“ggplot2”)
require(ggplot2)
p <- ggplot(data=newdata, mapping=aes(x=product_consumption_amount, y=increase, colour=cor))+geom_point() +labs(title=“貴族使用者分類”,x = “半年產品消費額(元)”,y = “半年月均增長率”)
使用主題:
install。packages(“devtools”)
library(devtools)
install_github(c(“hadley/ggplot2”, “jrnold/ggthemes”))
library(“ggplot2”)
library(“ggthemes”)
p + theme_igray() + scale_colour_tableau(“colorblind10”)


根據聚類結果,對聚類群體解釋命名:
聚類一:低價值,負增長群。(29%)
聚類二:低價值,穩增長群。(22%)
聚類三:中低價值,高增長群(12%)
聚類四:中高價值,負穩定群(33%)
聚類五:高價值,穩定群。(4%)
使用者群體
營銷策略
低價值,負增長群。
吸引使用者消費,提高使用者消費天數和消費金額,減少使用者流失。
低價值,穩增長群。
吸引使用者消費,提升使用者消費金額,穩定使用者群,給予業務回饋。
中低價值,高增長群。
提升使用者消費金額,穩定使用者群,給予業務回饋,紅鑽回饋等。
中高價值,穩定群。
拉昇使用者消費,同時提升使用者對產品的忠誠度。給予服務回饋,業務回饋,紅鑽回饋等。
高價值,穩定群。
提升使用者對貴族產品的認可度和忠誠度。給予服務回饋,業務回饋,紅鑽回饋等。
********************************************************************************************************
例子:
第一步:對資料集進行初步統計分析
檢查資料的維度
> dim(iris)
[1] 150 5
顯示資料集中的列名
> names(iris)
[1] “Sepal。Length” “Sepal。Width” “Petal。Length” “Petal。Width” “Species”
顯示資料集的內部結構
> str(iris)
‘data。frame’: 150 obs。 of 5 variables:
$ Sepal。Length: num 5。1 4。9 4。7 4。6 5 5。4 4。6 5 4。4 4。9 。。。
$ Sepal。Width : num 3。5 3 3。2 3。1 3。6 3。9 3。4 3。4 2。9 3。1 。。。
$ Petal。Length: num 1。4 1。4 1。3 1。5 1。4 1。7 1。4 1。5 1。4 1。5 。。。
$ Petal。Width : num 0。2 0。2 0。2 0。2 0。2 0。4 0。3 0。2 0。2 0。1 。。。
$ Species : Factor w/ 3 levels “setosa”,“versicolor”,。。: 1 1 1 1 1 1 1 1 1 1 。。。
顯示資料集的屬性
> attributes(iris)
$names ——就是資料集的列名
[1] “Sepal。Length” “Sepal。Width” “Petal。Length” “Petal。Width” “Species”
$row。names ——個人理解就是每行資料的標號
[1] 1 2 3 4 5 6 7 8 9 10 11 12 13 14 15 16 17 18 19 20
[21] 21 22 23 24 25 26 27 28 29 30 31 32 33 34 35 36 37 38 39 40
[41] 41 42 43 44 45 46 47 48 49 50 51 52 53 54 55 56 57 58 59 60
[61] 61 62 63 64 65 66 67 68 69 70 71 72 73 74 75 76 77 78 79 80
[81] 81 82 83 84 85 86 87 88 89 90 91 92 93 94 95 96 97 98 99 100
[101] 101 102 103 104 105 106 107 108 109 110 111 112 113 114 115 116 117 118 119 120
[121] 121 122 123 124 125 126 127 128 129 130 131 132 133 134 135 136 137 138 139 140
[141] 141 142 143 144 145 146 147 148 149 150
$class ——表示類別
[1] “data。frame”
檢視資料集的前五項資料情況
> iris[1:5,]
Sepal。Length Sepal。Width Petal。Length Petal。Width Species
1 5。1 3。5 1。4 0。2 setosa
2 4。9 3。0 1。4 0。2 setosa
3 4。7 3。2 1。3 0。2 setosa
4 4。6 3。1 1。5 0。2 setosa
5 5。0 3。6 1。4 0。2 setosa
檢視資料集中屬性Sepal。Length前10行資料
> iris[1:10, “Sepal。Length”]
[1] 5。1 4。9 4。7 4。6 5。0 5。4 4。6 5。0 4。4 4。9
同上
> iris$Sepal。Length[1:10]
[1] 5。1 4。9 4。7 4。6 5。0 5。4 4。6 5。0 4。4 4。9
顯示資料集中每個變數的分佈情況
> summary(iris)
Sepal。Length Sepal。Width Petal。Length Petal。Width Species
Min。 :4。300 Min。 :2。000 Min。 :1。000 Min。 :0。100 setosa :50
1st Qu。:5。100 1st Qu。:2。800 1st Qu。:1。600 1st Qu。:0。300 versicolor:50
Median :5。800 Median :3。000 Median :4。350 Median :1。300 virginica :50
Mean :5。843 Mean :3。057 Mean :3。758 Mean :1。199
3rd Qu。:6。400 3rd Qu。:3。300 3rd Qu。:5。100 3rd Qu。:1。800
Max。 :7。900 Max。 :4。400 Max。 :6。900 Max。 :2。500
顯示iris資料集列Species中各個值出現頻次
> table(iris$Species)
setosa versicolor virginica
50 50 50
根據列Species畫出餅圖
> pie(table(iris$Species))
算出列Sepal。Length的所有值的方差
> var(iris$Sepal。Length)
[1] 0。6856935
算出列iris$Sepal。Length和iris$Petal。Length的協方差
> cov(iris$Sepal。Length, iris$Petal。Length)
[1] 1。274315
算出列iris$Sepal。Length和iris$Petal。Length的相關係數, 從結果看這兩個值是強相關。
> cor(iris$Sepal。Length, iris$Petal。Length)
[1] 0。8717538
畫出列iris$Sepal。Length分佈柱狀圖
> hist(iris$Sepal。Length)
畫出列iris$Sepal。Length的密度函式圖
> plot(density(iris$Sepal。Length))
畫出列iris$Sepal。Length和iris$Sepal。Width的散點圖
> plot(iris$Sepal。Length, iris$Sepal。Width)
繪出矩陣各列的散佈圖
> plot(iris)
or
> pairs(iris)
第二步:使用knn包進行Kmean聚類分析
將資料集進行備份,將列newiris$Species置為空,將此資料集作為測試資料集
> newiris <- iris
> newiris$Species <- NULL
在資料集newiris上執行Kmean聚類分析, 將聚類結果儲存在kc中。在kmean函式中,將需要生成聚類數設定為3
> (kc <- kmeans(newiris, 3))
K-means clustering with 3 clusters of sizes 38, 50, 62: K-means演算法產生了3個聚類,大小分別為38,50,62。
Cluster means: 每個聚類中各個列值生成的最終平均值
Sepal。Length Sepal。Width Petal。Length Petal。Width
1 5。006000 3。428000 1。462000 0。246000
2 5。901613 2。748387 4。393548 1。433871
3 6。850000 3。073684 5。742105 2。071053
Clustering vector: 每行記錄所屬的聚類(2代表屬於第二個聚類,1代表屬於第一個聚類,3代表屬於第三個聚類)
[1] 1 1 1 1 1 1 1 1 1 1 1 1 1 1 1 1 1 1 1 1 1 1 1 1 1 1 1 1 1 1 1 1 1 1 1 1
[37] 1 1 1 1 1 1 1 1 1 1 1 1 1 1 2 2 3 2 2 2 2 2 2 2 2 2 2 2 2 2 2 2 2 2 2 2
[73] 2 2 2 2 2 3 2 2 2 2 2 2 2 2 2 2 2 2 2 2 2 2 2 2 2 2 2 2 3 2 3 3 3 3 2 3
[109] 3 3 3 3 3 2 2 3 3 3 3 2 3 2 3 2 3 3 2 2 3 3 3 3 3 2 3 3 3 3 2 3 3 3 2 3
[145] 3 3 2 3 3 2
Within cluster sum of squares by cluster: 每個聚類內部的距離平方和
[1] 15。15100 39。82097 23。87947
(between_SS / total_SS = 88。4 %) 組間的距離平方和佔了整體距離平方和的的88。4%,也就是說各個聚類間的距離做到了最大
Available components: 執行kmeans函式返回的物件所包含的各個組成部分
[1] “cluster” “centers” “totss” “withinss”
[5] “tot。withinss” “betweenss” “size”
(“cluster”是一個整數向量,用於表示記錄所屬的聚類
“centers”是一個矩陣,表示每聚類中各個變數的中心點
“totss”表示所生成聚類的總體距離平方和
“withinss”表示各個聚類組內的距離平方和
“tot。withinss”表示聚類組內的距離平方和總量
“betweenss”表示聚類組間的聚類平方和總量
“size”表示每個聚類組中成員的數量)
建立一個連續表,在三個聚類中分別統計各種花出現的次數
> table(iris$Species, kc$cluster)
1 2 3
setosa 0 50 0
versicolor 2 0 48
virginica 36 0 14
根據最後的聚類結果畫出散點圖,資料為結果集中的列“Sepal。Length”和“Sepal。Width”,顏色為用1,2,3表示的預設顏色
> plot(newiris[c(“Sepal。Length”, “Sepal。Width”)], col = kc$cluster)
在圖上標出每個聚類的中心點
〉points(kc$centers[,c(“Sepal。Length”, “Sepal。Width”)], col = 1:3, pch = 8, cex=2)


